
A price-shock estimate, not a measure of total economic damage
The USD 330 billion figure attached to the Iran war is best understood as an estimate of additional payments for imported energy rather than a calculation of worldwide economic losses. The Centre for Research on Energy and Clean Air (CREA) estimates that importers paid that amount above the prices futures markets had anticipated before the conflict, for seaborne crude oil, refined petroleum products and liquefied natural gas (LNG) bought between March and August 2026.
That distinction matters. The calculation does not say that USD 330 billion disappeared from the global economy. Higher commodity prices also increased revenues for exporters. Nor does it encompass every effect of the conflict: freight and war-risk costs, pipeline gas, coal, fuel oil, naphtha, taxes, subsidies, consumer-price effects and the economic cost of energy that households and firms could no longer afford are outside the headline figure.
It is nevertheless a useful indicator of the scale of the disruption. By comparing actual market prices with the futures curve prevailing from February 16 to 27, shortly before the strikes on Iran, the analysis measures how far a transport and supply shock altered import payments from the path markets had expected. It also values actual volumes purchased, meaning that demand destruction is already reflected in the totals.
Crude oil led the increase, but fuel and gas pressures were broad
Crude oil accounted for USD 164.1 billion of the estimated gross increase, nearly half the total. Diesel and gasoil added USD 73.8 billion, gasoline USD 35.7 billion, LNG USD 38 billion and jet fuel USD 20 billion. The split illustrates that the disruption was not simply an oil-price story. It passed through refineries, shipping routes, gas markets and transport fuels.
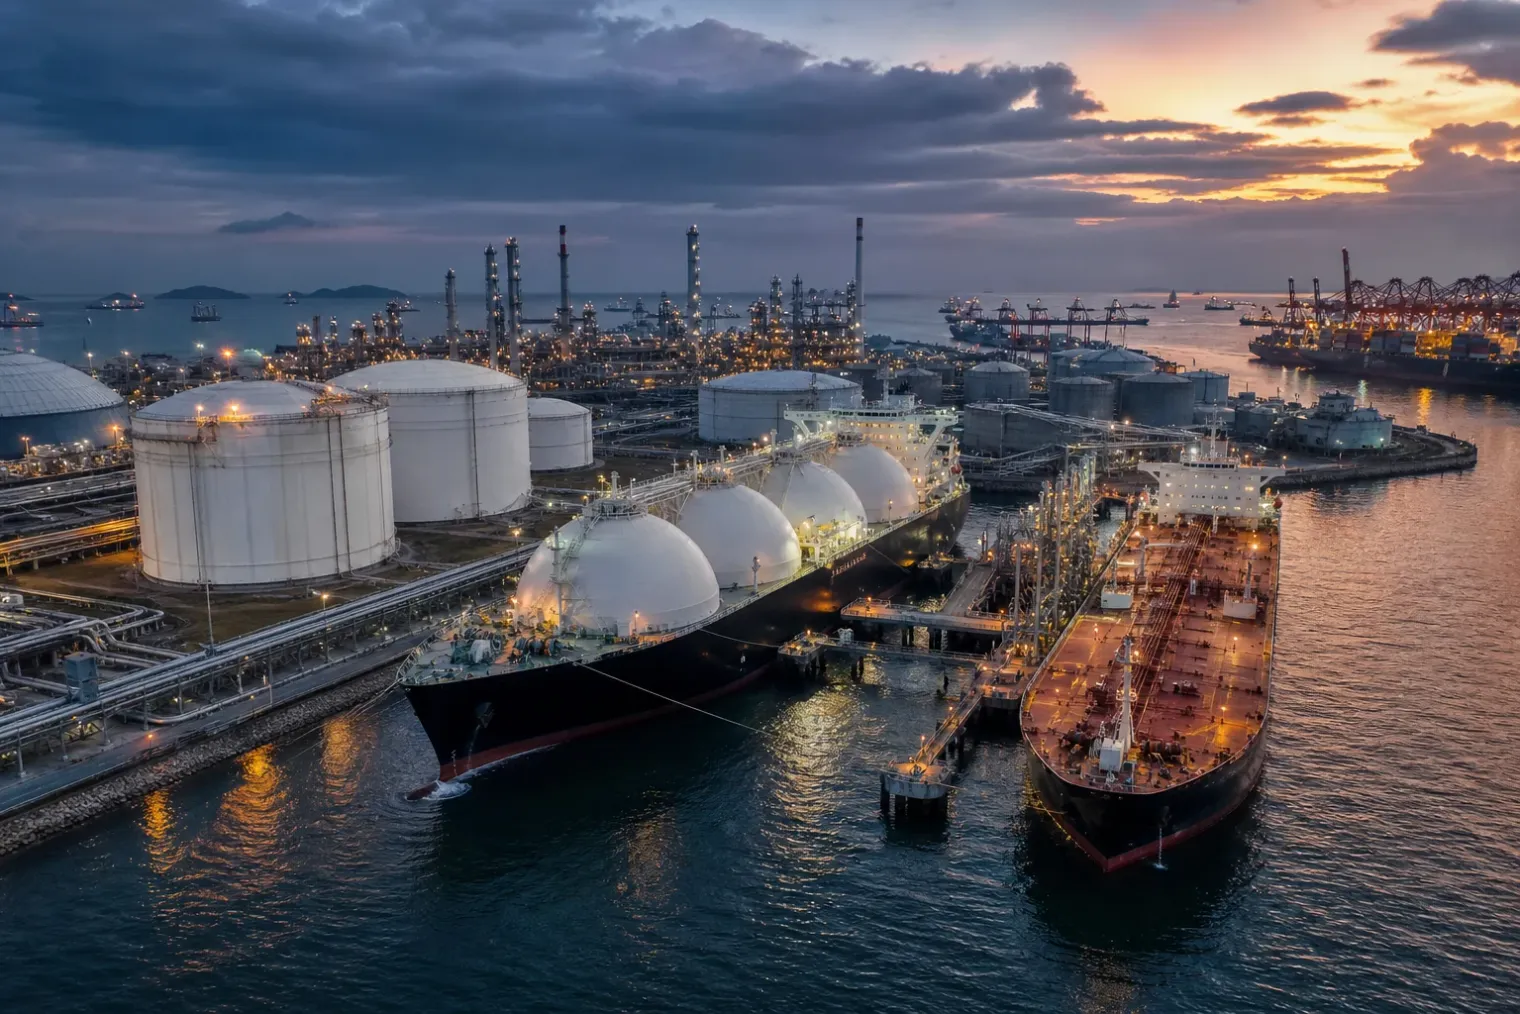
The pressure on LNG has been especially important for import-dependent economies. The International Energy Agency says the effective closure of the Strait of Hormuz disrupted flows that had represented almost one-fifth of global LNG supply. Qatar and the United Arab Emirates saw LNG loadings fall sharply from March through June, although higher output from producers outside the Gulf offset much of the lost supply.
Prices eased from their early-crisis peaks after the mid-June interim agreement between the United States and Iran raised hopes of a reopening of the strait. Yet trade flows had not returned to normal. The IEA expects the recovery of Gulf deliveries to be gradual and warns that damage to gas infrastructure could keep the LNG market tighter than previously expected beyond 2026.
Europe, China and India had the largest gross import exposure
On CREA’s gross measure, the European Union faced the largest additional import cost, at about USD 78 billion, followed by China at USD 35 billion and India at USD 22 billion. These numbers describe the higher cost of fuel cargoes arriving in those markets before subtracting each economy’s additional export earnings.
The net picture is more nuanced. CREA estimates that the EU’s net additional fossil-fuel cost was USD 54 billion, while East Asia’s was USD 49 billion. China was the largest individual net payer across the fuels studied, at USD 31.7 billion. India’s net cost was USD 14.4 billion, Japan’s USD 10.4 billion, and France and Italy each absorbed about USD 10 billion.
Regional averages can conceal divergent outcomes. North America, the Middle East and Russia were estimated to have gained overall from higher export revenues, while several countries within regions that appeared broadly balanced still paid substantially more for imports. Africa, for example, was nearly neutral in aggregate because of exporter gains, but Egypt, South Africa and Morocco were among the countries facing sizeable increased bills.
The economic burden is also not proportionate to national income. China’s estimated net cost equalled 0.17% of GDP, while Egypt’s USD 5.2 billion net cost represented 1.33% of GDP. CREA estimates that the typical low- or lower-middle-income importer faced an impact equal to 1.0% of GDP, compared with 0.45% for the typical high-income importer. These ratios are measures of exposure to higher import costs, not forecasts of lost GDP.
The methodology is deliberately narrow — and conservative in some respects
CREA’s approach has clear strengths. It uses a pre-conflict futures curve rather than an arbitrary historical price, aligns realised prices with the relevant market instruments, and bases trade volumes on observed seaborne arrivals. This helps distinguish the crisis premium from normal seasonal changes that markets had already expected.
There are also limitations that should prevent the number from being treated as a complete balance sheet of the war. August volumes were partly projected using prior seasonal patterns, and about USD 6 billion of import costs could not be assigned to a particular destination because of gaps in ship-tracking data. LNG pricing in Asia also relies on an assumption about the share of imports bought through spot and short-term contracts.
Most importantly, the calculation excludes freight and insurance costs. Those omissions mean the narrow import-payment estimate may understate what buyers ultimately paid for delivered fuel. At the same time, the estimate does not capture the welfare costs of reduced energy use, disrupted industrial production, broader inflation or the fiscal effect of subsidies. It should therefore not be used as a proxy for the conflict’s total impact on growth, public finances or household living standards.
Clean-power growth provided a partial buffer
The report also identifies a countervailing effect from added non-fossil electricity generation. CREA estimates that clean-power growth since 2020 avoided USD 36 billion in coal, gas and oil imports from March to July 2026. China and Japan recorded the largest absolute savings, while some smaller import-dependent economies avoided a much larger share of the fossil-fuel bill they otherwise would have faced.
This does not mean renewables insulated economies from the crisis. The avoided-import calculation is a modelled counterfactual, and its result depends on assumptions about the fuels that would otherwise have been burned for electricity. Still, the direction is economically significant: power systems requiring less imported gas, coal and oil have less direct exposure when fuel trade routes and benchmark prices are disrupted.
For governments, the immediate response will continue to include emergency stocks, supply diversification, demand restraint and temporary support for consumers. The longer-term lesson is broader. Energy security is shaped not only by the availability of barrels or LNG cargoes, but also by exposure to concentrated shipping corridors, refinery capacity, flexibility in electricity systems and the ability to reduce imported fuel demand when prices surge.
The USD 330 billion estimate captures only one part of that story. Its value is in showing how a regional conflict can rapidly transfer large costs to import-dependent economies well beyond the area of fighting — and why the eventual reopening of a trade route may not immediately restore the previous price environment.
Sources
- Iran War Adds $330 Billion to Global Energy Import Bill — Yahoo Finance
- What the Hormuz crisis has cost fossil fuel importers — March to August 2026 — Centre for Research on Energy and Clean Air
- Gas Market Report, Q3-2026: Executive summary — International Energy Agency
- 2026 Energy Crisis Policy Response Tracker — International Energy Agency


